
TL;DR: AI trend forecasting for ecommerce combines machine learning with real-time external signals to identify rising product demand before it peaks in your order history. Acting on those signals early cuts stockouts, reduces dead stock, and sharpens launch timing. This guide covers the data inputs, tools, and KPIs that make it work in practice.
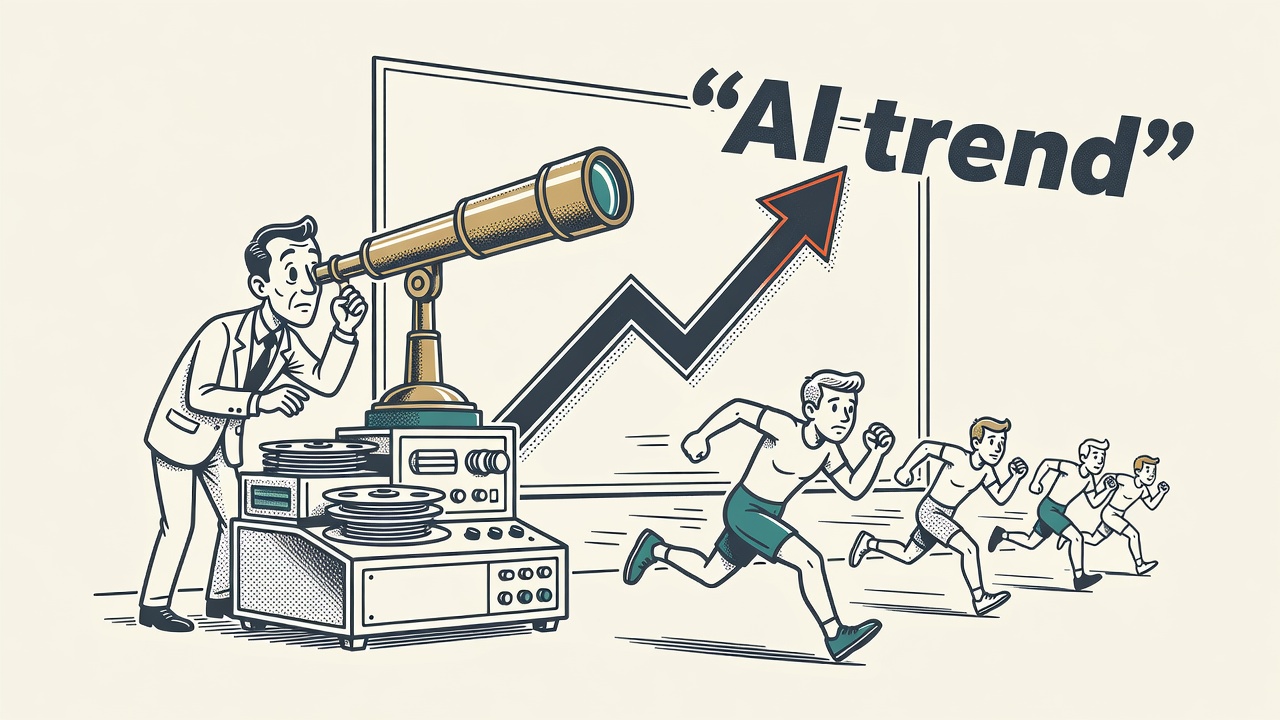
AI trend forecasting for ecommerce is the practice of using machine learning models to analyze historical sales data, customer behavior, and external market signals to predict which products will see rising demand before it shows up in your order history. Getting ahead of a trend by even two to four weeks changes your inventory position, your pricing decisions, and your marketing timing. The merchants winning on trend timing are not guessing better than competitors; they are feeding better data into smarter models.
What AI Trend Forecasting for Ecommerce Does for Your Business
The practical advantage is acting before competitors respond. When a product trend shows up in social and search signals weeks before it appears in order histories, merchants reading those signals can source inventory, set promotional budgets, and schedule launches at normal market conditions rather than scrambling to catch up once demand has already moved.
The business case is anchored in real market scale. Precedence Research put the global applied AI in retail and ecommerce market at USD 60.30 billion in 2025, rising to a projected USD 72.42 billion in 2026, with a compound annual growth rate of 20.10% forecast through 2035. Coherent Market Insights estimates the AI in ecommerce segment at USD 9.70 Bn in 2026, growing at 25.7% annually through 2033. That investment reflects merchant demand for tools that deliver measurable margin impact, not analytical novelty.
For a store selling seasonal or trend-driven products, catching a demand wave two to four weeks early can be the difference between a sell-through and a clearance event. For a store that stocks year-round basics, the same models help smooth replenishment cycles and flag unexpected demand spikes before a competitor captures the sale.
AI Trend Forecasting vs. Demand Forecasting in Ecommerce
Demand forecasting and trend forecasting solve different problems at different points in your planning cycle. Demand forecasting takes your order history, applies seasonal adjustments, and tells you how many units of a known SKU to reorder. It works well when you already know what to stock. Trend forecasting works earlier. It identifies which products or categories will see rising interest using external signals, before your own sales data records any movement.
A product trending on TikTok with zero units sold in your catalog is invisible to demand forecasting. It is exactly the kind of early-stage signal that trend models are built to catch. The two approaches are complementary. Most sophisticated ecommerce operations run demand forecasting for replenishment and trend forecasting for assortment decisions and launch timing.
| Dimension | Demand Forecasting | AI Trend Forecasting |
|---|---|---|
| Primary Question | How much of this SKU will sell? | Which products will see rising demand? |
| Time Horizon | Days to weeks ahead | Weeks to months ahead |
| Key Inputs | Order history, promotions, seasonality | Social signals, search trends, browse behavior, competitor data |
| Main Output | Replenishment quantity for known SKUs | Emerging demand signals and rising categories |
| Best Used For | Inventory replenishment planning | Product selection, launch timing, range expansion |
The Data Sources That Power AI Trend Forecasting for Ecommerce
Clean, centralized data is the foundation of any forecasting system. On the internal side, the most valuable inputs are order history by SKU and date, on-site search queries (what visitors search for that may not yet be in your catalog), product page view and add-to-cart rates, and returns data. Your ERP and WMS hold most of this. Google Analytics 4 (GA4) captures the browse and search behavior your order management system cannot see.
External data sources are what separate AI trend forecasting from a standard reorder model. Google Trends shows rising search interest for product terms before purchases happen. Social listening tools pull volume and sentiment from TikTok and Instagram. Competitor pricing feeds reveal when rivals are liquidating or repositioning, which often precedes category demand shifts. Weather APIs feed seasonal models for apparel, outdoor gear, and home goods. The more external signals you layer in, the earlier your model detects a coming demand shift.
Tools like Klaviyo provide another input layer: behavioral data from email and SMS campaigns. Open rates, click patterns, and browsing sessions recorded by your marketing platform are predictive inputs that many merchants underuse. Connecting your CRM, your ad platform data from Meta Ads, Google Ads, and TikTok Ads, and your site analytics into a single clean data warehouse is the setup work that makes your model progressively sharper over time.
External Signals That Improve Ecommerce Trend Forecasts the Most
Not all external signals carry equal predictive weight. Social media velocity, specifically how fast a product or style picks up hashtag volume and engagement on TikTok and Instagram, tends to have the shortest lead time before it converts to purchase intent. A sound or format trend on TikTok can turn a niche product into a search-and-buy event within 48 hours. Wiring real-time social monitoring into your forecasting pipeline captures that early window before competitors react.
Search interest data from Google Trends provides a slightly longer lead signal. A product term climbing in search volume over 30 to 60 days before your own sales move is exactly the pattern trend models are trained to detect. Weather signals matter for specific categories: a forecast of an early cold snap drives jacket and boot searches days before temperatures drop. Combining calendar events, news cycles, and weather data gives your model context that pure sales history cannot provide.
Influencer and media coverage is a reliable leading indicator for categories where editorial opinion shapes purchase decisions. A product featured in a major publication or picked up by a creator with a large following often generates a demand spike within days. Some merchants wire news API feeds and influencer mention tracking directly into their forecasting inputs. No single external signal is the whole picture, but letting the model weight signals based on which have historically correlated with actual demand in your specific category is how you make the combination pay off.
Worth Knowing: TikTok’s own search bar generates query data entirely separate from Google search volume, and several trend intelligence platforms now track it as a distinct feed. For beauty, apparel, and home goods, TikTok search spikes frequently precede Google Trends movement by days to a few weeks. If your forecasting data pipeline does not include TikTok-specific search data, you may be missing the earliest demand signal in your category entirely.
AI Tools for Ecommerce Product Trend Prediction
Several tool categories cover different points on the cost-and-complexity spectrum. Shopify has built AI demand forecasting capabilities into its admin and analytics layer, surfacing predicted demand in inventory reports and giving merchants a starting point without custom model work. For stores on Shopify Plus or with developer resources, connecting GA4 behavioral data and third-party trend feeds extends what those built-in signals can reach.
On the open-source side, Prophet (released by Meta’s core data science team) handles seasonal time-series data well and produces reasonable forecasts with less historical data than classical models require. ARIMA remains a solid baseline for stores with at least 12 to 18 months of clean sales history. When you add more features, specifically social signals, price variables, and promotional flags, gradient boosting models like XGBoost and LightGBM typically outperform ARIMA because they handle tabular data with many input columns more effectively. Enterprise operations with large transaction volumes and complex product mixes sometimes move to neural network forecasting models, which can learn nonlinear demand patterns across product lines.
Klaviyo connects behavioral signals from email and SMS to your product data, making it a useful input layer even though it is not a forecasting engine itself. For stores without engineering resources to build and maintain custom models, third-party forecasting platforms integrate directly with Shopify or WooCommerce and wrap model selection and retraining in a managed interface. The right choice depends on your data volume, product mix complexity, and whether you have in-house capacity to monitor model performance over time.
Seasonal Accuracy, Model Retraining, and KPIs to Track
Seasonal products present a specific forecasting challenge. A model trained only on annual averages will miss the shape of a demand spike: how steep it is, how early it starts, and how quickly it drops off after peak. Incorporating short-term external signals, specifically search trends and social volume in the weeks before a season, consistently improves seasonal accuracy compared to models that rely on historical averages alone. Retrain seasonal models monthly in the two to three months before peak periods such as Q4, back-to-school, and major promotional events, rather than relying on a single annual refresh.
For non-seasonal products, quarterly retraining is a reasonable baseline. Retrain promptly after any major campaign, a new product category launch, or an external disruption such as a supply chain delay. Model drift, where accuracy degrades as real-world patterns shift away from training data, is the most common cause of forecasting failures in stores that deploy a model and never revisit it.
Measuring forecasting performance requires a focused set of KPIs. Mean Absolute Percentage Error (MAPE) quantifies how far your forecast deviates from actual demand as a percentage, giving you an accuracy benchmark comparable across SKUs of different sales volumes. Forecast bias reveals whether your model consistently over-predicts or under-predicts, which points to systematic problems in your input data or model assumptions. On the operational side, track stockout rate (the percentage of demand events where a product is unavailable), fill rate (the proportion of orders fulfilled from available stock on the first attempt), and inventory turnover days. Together these five metrics tell you whether better forecasting is translating into better actual inventory decisions.
Quick Takeaways
- Catching a demand wave two to four weeks early means sourcing inventory at regular cost before supplier prices and shipping rates respond to the surge.
- Add a TikTok-specific search data feed to your forecasting pipeline. For beauty, apparel, and home goods, relying only on Google Trends means your model reads category momentum days to weeks after the earliest signal has already appeared on TikTok.
- Prophet handles seasonal forecasting better than ARIMA for stores with under two years of sales history, because it requires fewer data points to model seasonal patterns with reasonable confidence intervals.
- Set calendar reminders to retrain models monthly before Black Friday, back-to-school, and major promotions. Waiting until a season starts means your model is working from last year’s conditions, not current signals.
- If MAPE improves but stockout rate stays flat, your forecast model outputs are not connected to your actual purchasing workflow. Check whether model predictions feed directly into your reorder triggers.
Frequently Asked Questions
- How does AI trend forecasting for ecommerce differ from standard demand forecasting?
- Demand forecasting tells you how much of a product you already carry to reorder, using your own sales history as the primary input. AI trend forecasting tells you which products to carry or prioritize next, by reading external signals such as search interest and social media velocity before your order history records any movement. Run both in parallel: replenishment relies on demand forecasting, while new product selection and launch timing rely on trend signals.
- What data does a small Shopify store need to start AI trend forecasting?
- A practical starting point is 12 months of order history at the SKU level, paired with free external signals: GA4 on-site search reports, Google Trends data for your core product categories, and social monitoring on TikTok and Instagram. Open-source tools like Prophet can produce useful seasonal forecasts from these inputs without requiring a dedicated data science team or a large data warehouse.
- How accurate are AI forecasting models for seasonal products?
- Seasonal model accuracy varies by category, data quality, and the range of inputs used. Models that incorporate short-term external signals such as rising search interest and social volume in the weeks before a seasonal peak consistently outperform models trained on historical averages alone. Retraining monthly in the two to three months before a peak period, rather than relying on a single annual model update, is the most reliable way to improve seasonal accuracy.
- How often should an ecommerce store retrain its forecasting models?
- Quarterly retraining works well for products with stable, year-round demand. If you carry seasonal lines, build monthly retraining into the calendar for the eight to twelve weeks before each peak period. Any major campaign, new category launch, or supply chain disruption is also a trigger: real-world changes shift the patterns your model learned, and a stale model will quietly lose accuracy without obvious warning signs.
- Which KPIs should I track to evaluate my forecasting performance?
- Track Mean Absolute Percentage Error (MAPE) as your primary model accuracy metric, and forecast bias to detect whether your model is systematically over-predicting or under-predicting demand. On the operational side, watch three inventory outcomes: stockout frequency, order fill rate, and how quickly stock turns over. Improving MAPE without seeing gains in those operational metrics typically means your forecast model is not yet connected to actual purchasing and replenishment decisions.